Several years ago I attended a safety seminar hosted by Seacare. Maritime safety is not part of my “brief” but safety is, and I was seeking alternate perspectives on my specialist area. Seacare conducted a session where the treatment and management of an injured worker was work-shopped from incident to return-to-work.
It was the first time I had seen a panel of experts deal with the life of a worker across the injury management continuum. The session showed the necessity to communicate across several disciplines and to always keep the focus on the injured worker. I had never seen a better example of risk management in relation to an employee’s welfare.
If only the real world was as organised.
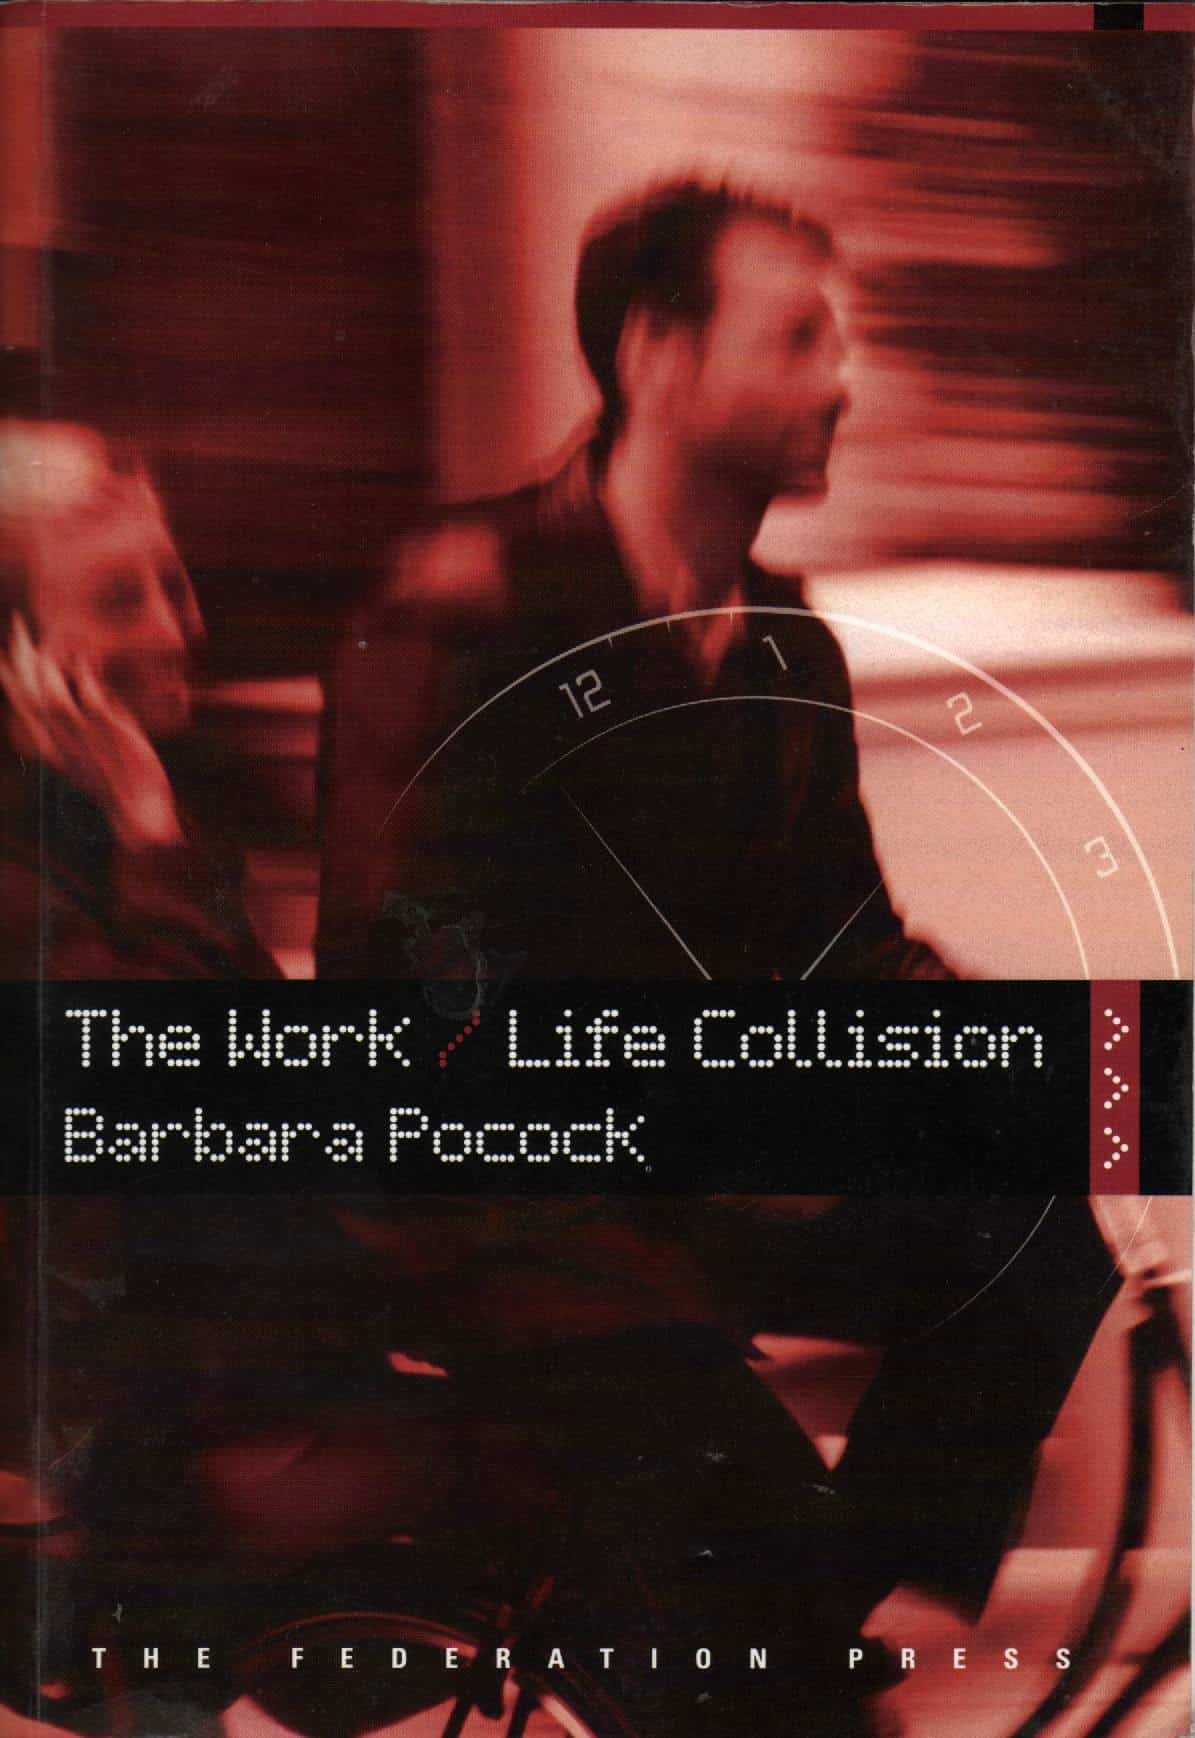
 Work/life balance in Australia is skewed towards those workers who have young families or a role as a carer. This is due to work/life balance evolving from the feminist and social concepts of the 1970s and in response to the increased number of women in paid employment. Barbara Pocock sees these matters in the 1970s as themselves a reaction to the “male-dominated employing class” that, in one exampled, believed that 3 month’s long-service leave was more important than maternity leave. (p212, The Work/Life Collision)
Work/Life Balance Origin
(Wikipedia has a peculiar article on work/life balance that has some interesting points and reference links but then undoes its good work by relying on a couple of major sources and many of them are commercial consultants. That the Australian work in this area is not referenced, indicates a major deficiency. Please note that the concept of balancing work life and non-work life existed well before “work/life balance” was first used. SafetyAtWorkBlog would point the concept’s origin to around the same time as Australia’s introduction of the eight hour day in the mid-1800s or even earlier with Robert Owen in the UK calling for a 10-hour day.)
 In the 2000s the emphasis remains not on work/life balance but work/family. As a result, work/life balance will remain an issue handled in the management silo of human resources and being seen as relevant to a lifestage of an individual rather than the individual themselves. There is also an inherent gender bias that could be minimised if the silo was removed.
The Seacare workshop illustrated for me that an injured worker is managed by different silos throughout their rehabilitation. Wherever possible the employer outsources this management to experts in OHS, trauma counselling, medicine, physiotherapy, return-to-work coordinators, and other specialists. The common element through all of these silos is the individual and that person’s health.
OHS & Work/Life Conflict
 Occupational health and safety has a big advantage over work/life balance in that it focuses on the individual first. Employers must provide for the health and safety of the worker and, by and large, employers get the safety obligation right. This part of the process has long-established practices based principally on engineering solutions – stopping things falling on a worker, stopping the worker falling into machinery, stopping the inhalation of toxic dust – effectively “blue collar” solutions to “blue collar” hazards.
The mental health of the worker was not a big concern. This is partly because in most of Australia, legislation only ever related to health and safety, and rarely to welfare. Where welfare was a legislated consideration for the management of workers, the social context of the worker was acknowledged myuch earlier and work/life issues began to grow.
The regrettable element of this evolution was that “health” remained a narrow workplace definition instead of embracing the “welfare” or mental health of the worker. If health had been supported by a definition that included welfare in all Australian States’ OHS legislation, the mental health needs of workers and the social contexts of worker management would have been discussed much earlier and in parallel.
Work/Life Balance Awards – A Missed Opportunity
An example of the divergence and the need, in my opinion, to reintegrate work/life balance and occupational health comes from some correspondence I have had with the organisers of the National Work/Life Balance Awards in the Australian Department of Education, Employment and Workplace Relations (DEEWR). Until very recently, these awards were called the National Work and Family Awards.
 DEEWR includes in its structure Safe Work Australia, the organisation responsible for monitoring OHS across the country. It seemed odd to me, from the big holistic picture, that DEEWR has not included Safe Work Australia in the judging panel for the 2009 Work/Life Balance Awards. DEEWR advised me that it believes the OHS experience of two of the judging panel, the Australian Council of Trade Unions and the Australian Chamber of Commerce and Industry, was sufficient. Perhaps but why not draw on the OHS expertise of one’s own staff as well?
It also seemed odd that one organisation would conduct two national awards programs – the National Work/Life Balance Awards and the Safe Work Australia Awards. DEEWR advised me that
“The [National Work/Life Balance Awards] recognise organisations that are outstanding in achieving positive outcomes through the implementation and communication of work-life balance policies, practices and initiatives which meet the needs of both the employer and its employees. The Safe Work Australia Awards focus on OHS more broadly and recognise businesses and individuals for their outstanding efforts in OHS and for making safety a high priority in their workplace.”
If the Safe Work Australia Awards focus on “OHS more broadly” why not have one set of awards that acknowledges both the work and social contexts of employees? This is harder to answer when
“Applicants for awards must consent to an assessment to determine whether they have complied with the Fair Work Act 2009, the Workplace Relations Act 1996 and any relevant state or territory legislation, award or other industrial instruments” [my emphasis]
This would surely include the OHS legislation of each State and the Commonwealth.
DEEWR does not involve any of the state OHS regulators in the awards process. The judging panel does not analyse the workers’ compensation premium awards rates of award contenders. State regulators could surely provide a useful perspective as it is mostly under their jurisdictions that businesses are prosecuted for OHS breaches. Worker’s compensation premiums are used by all regulators as a major (sometime the only) indicator of safety performance and for targeting of enforcement programs. The judges of the National Work/Life Balance Awards do not.
OHS professionals and return-to-work coordinators acknowledge that the non-work life and mental health of workers are important elements in regaining a fully-functional employee.
DEEWR made the decision to rebrand the awards to Work/Life instead of “work and family”. This does not reflect the complex interrelations of the social and individual contexts of the health and safety of individual workers.
DEEWR is coordinating the reforms of laws into both OHS and workers compensation. The Australian Government is working on legislative harmonisation across all legislative jurisdictions in workplace health and safety. These OHS laws are likely to extend employer obligations well beyond workers to the public and those potentially affected by work practices..
However DEEWR is missing a major opportunity to set the agenda for the future by acknowledging that the impacts on an individual of the work life and the home life should be managed across the social and employment disciplines.
The images included in this posting show some of the many terrific books dealing with, or mentioning, work/life management.


