Australian Statistics – Part 4 – Shiftwork

Safe Work Australia has released four statistical reports into worker health in Australia.  These are important and useful reports that will assist many companies and safety professionals to better address workplace hazards.
Pages from ShiftworkThe last of the four statistical reports looks at shiftwork.

The impact of shiftwork on work-related injuries in Australia

The main findings of this report are summarised below:

  • In 2005–06, 16% of Australian workers worked under shift arrangements yet they had 27% of the work-related injuries.
  • Shiftworkers had higher rates of work-related injury than non-shiftworkers.
    • Incidence rates
      • Shiftworkers: 114 injuries per 1000 shiftworkers
      • Non-shiftworkers: 60 injuries per 1000 non-shiftworkers
    • Frequency rates
      • Shiftworkers: 69 injuries per million hours worked
      • Non-shiftworkers: 35 injuries per million hours worked
  • Female shiftworkers had higher frequency rates of work-related injury than male shiftworkers. This finding is counter to the rates of work-related injury in male and female non-shiftworkers.
    • Shiftworkers
      • Female: 81 injuries per million hours worked
      • Male: 62 injuries per million hours worked
    • Non-shiftworkers
      • Female: 31 injuries per million hours worked
      • Male: 37 injuries per million hours worked
  • Female shiftworkers were particularly at risk of work-related injuries in Clerical, sales and service occupations, while male shiftworkers were particularly at risk in Labourer and related worker occupations.
  • Both shiftworkers and non-shiftworkers were more likely to incur work-related injuries during their first six months of employment than after their first six months of employment. Furthermore, a greater proportion of injuries that occurred to shiftworkers occurred in the first 6 months of employment than occurred to non-shiftworkers in the same initial period of employment.
  • The frequency rate of work-related injuries that occurred to shiftworkers is negatively related to normal working hours: Shiftworkers that worked only a few shifts per week had considerably higher frequency rates of work-related injury compared to shiftworkers (and non-shiftworkers) whose normal working hours were between 35 and 40 hours per week.
  • Shiftworkers who worked less than 30 hours per week were typically young (less than 25 years old) and large proportions worked in Elementary clerical, sales and service worker, Intermediate clerical, sales and service and Labourer and related worker occupations.
  • High incidence rates of injury were not due to lack of Occupational Health and Safety (OHS) training. More shiftworkers received OHS training than not, and a greater proportion of shiftworkers received OHS training than non-shiftworkers.

Australian Statistics – Part 3 – Injury data comparison

Safe Work Australia was released four statistical reports into worker health in Australia. These are important and useful reports that will assist many companies and safety professionals to better address workplace hazards.

Pages from ComparisonwithNDSThis report is a comparison of two data sets in the hope that the report provides a more accurate picture of workplace injury rates than just that based on workers’ compensation claims.

NDS =National Data Set for Compensation based Statistics

WRIS = Australian Bureau of Statistics’ Work-Related Injuries

A detailed explanation of the sources and purposes of these data sets is in the full report.

Comparison of compensation data with all incurred work-related injuries

Comparison of the WRIS with published data on serious claims from the NDS indicates that the NDS represents only one in five work-related injuries occurring each year. In addition, this analysis has shown that the NDS collected information on only 63% of the injuries that involved a week or more off work in 2005–06. The analysis in this report, however, shows that the NDS still provides useful information on the characteristics of work-related injuries

To enable a more robust comparison, the two datasets were scoped to only include injuries with similar periods of time lost (one working week for the NDS and five or more days for the WRIS). The following points were observed

  • The NDS incidence rate for male employees was 80% of the WRIS rate but for female employees the NDS incidence rate was only 60% of the WRIS rate. This indicates that in 2005–06 female workers were less likely to claim workers’ compensation than male workers
  • While the two datasets produced similar incidence rates for age groups involving workers over 25 years of age, the NDS recorded only half the incidence rate of the WRIS for workers aged less than 25 years. This indicates that in 2005–06 young people were less likely to claim workers’ compensation than older workers
  • Both datasets indicated that the highest incidence rates in 2005–06 were recorded by the Agriculture, forestry and fishing, Manufacturing, Construction, Transport and storage and Mining industries. However, comparison of the two datasets indicates that the NDS underestimated incidence rates in the Retail trade, Health and community services, Education and Government administration and defence industries

These industries had high proportions of employees who were eligible for workers’ compensation and hence the data indicates that employees in these industries were less likely to claim workers’ compensation than those in other industries

  • Both datasets indicated the highest incidence rates by occupation groups were recorded by Labourers and related workers, Intermediate production and transport workers and Tradespersons and related workers. However, the data show that the NDS underestimates incidence rates for Managers and administrators
  • The way in which injuries occurred was similar between the two datasets, with 42% of injuries due to lifting, pushing and pulling objects
  • The two datasets agreed that the main type of injury was Sprains and strains. However, the analysis showed that the NDS only captured one in three injuries involving Stress or other mental condition and one in two injuries involving Fractures, Cut/open wound or Chronic joint or muscle condition

Australian Statistics – Part 2 – Workers’ Compensation

Safe Work Australia was released four statistical reports into worker health in Australia. These are important and useful reports that will assist many companies and safety professionals to better address workplace hazards.

Factors affecting applications for workers’ compensation

Pages from WCapplicationsThis report has identified several factors that affected the likelihood of employees making workers’ compensation claims and the reasons for not applying for workers’ compensation following a work-related injury. These include:

Sex

Female employees were less likely to apply for workers’ compensation for their work-related injury than male employees.

Of injuries that involved some time lost from work, 52% of female employees did not apply for compensation compared to 46% of male employees.

Reasons for not applying

Male and female employees did not apply for compensation for nearly four tenths of their injuries that involved some time lost from work because they considered the injury too minor to claim. For a further one-tenth of these injuries, male and female employees felt it was inconvenient or too much effort to apply.

Male employees did not apply for compensation for over two in ten injuries because they did not know they were eligible for compensation.

For female employees, nearly two in ten did not apply due to concerns about their current or future employment.

Age

Young female employees were least likely to claim workers’ compensation while males aged 45–54 years were most likely to claim compensation for injuries that involved some time lost from work.

Type of injury

The type of injury had little impact on whether an injured employee applied for workers’ compensation except in cases that involved stress or other mental conditions. While around half of all injuries that involved some time lost from work were claimed, injuries that involved stress were only claimed in 36% of cases.

Duration of employment

There was little difference in the percentage of employees who claimed workers’ compensation based on employment duration: employees with less than one year of employment claimed workers’ compensation for 52% of their time lost injuries compared to 47% of time lost injuries for those with more than one year of employment.

Alternative sources of financial assistance

Regular sick leave was used by nearly two in ten injured employees who did not apply for workers’ compensation

One in ten accessed government payments such as Medicare and Centrelink payments.

Full-time / part-time employment

Of the injuries incurred by full-time employees that involved some time lost from work, 47% applied for workers’ compensation compared to 53% of part time employees.

Unlike full-time employees, one of the main reasons why part-time employees did not apply for compensation was due to concern about current or future employment.

Leave entitlements

Of the injuries to employees with paid leave entitlements that involved some time lost from work, 56% applied for workers’ compensation compared to just 43% of employees without paid leave entitlements.

Injured employees without paid leave entitlements were three times as likely to think they were not eligible for workers’ compensation as employees with paid leave entitlements.

Australian Statistics – Part 1 – Employment Conditions

Safe Work Australia was released four statistical reports into worker health in Australia.  These are important and useful reports that will assist many companies and safety professionals to better address workplace hazards.

Pages from EmploymentconditionsSafetyAtWorkBlog is going to present some of the data in four blog articles, without commentary or interpretation, which is the usual approach.  Each article will be the summary of findings from each report.  Readers are strongly encouraged to download and read the full reports (links to each will be included in each article) as the summaries do not fully reflect the complexity of the analysis.

We want to thank the Safe Work Australia for their decision to provide such data.  It is an optimistic sign of improved communication for the national organisation.

The impact of employment conditions on work-related injuries in Australia

Employment status

  • Employees accounted for 88% of the total workforce in 2005-06.  Employees recorded a higher incidence rate of work-related injury compared to Employers or Own account workers (E/OAWs): 71 injuries per 1000 employees compared to 52 injuries per 1000 E/OAWs.
  • Employees recorded higher incidence rates in all industries except the Construction industry where similar rates were recorded for the two employment types.
  • Employees recorded higher incidence rates in all occupations except for Managers and administrators where E/OAWs recorded 76 injuries per 1000 workers compared to 53 for Employees.
  • Male employees recorded an incidence rate 1.4 times the rate for female employees whereas male E/OAWs recorded an incidence rate twice the rate of female E/OAWs.
  • E/OAWs recorded 19 injuries per 1000 E/OAWs for injuries involving five days or more compared to 21 for Employees.

Leave entitlements

  • Employees with leave entitlements recorded higher incidence rates of injury (76 injuries per 1000 workers) than employees without leave entitlements (66 injuries per million hours worked).
  • When hours of work were examined, it was found that full-time workers experienced the same frequency rate of injury regardless of whether they had access to paid leave or not. The same pattern was observed for part-time workers, though frequency rates for part-time workers were double those of full-time workers.
  • Male employees without leave entitlements recorded the highest frequency rates of work-related injury, substantially above male employees with leave entitlements and higher than female employees without leave entitlements.
  • Male and female frequency rates for employees with leave entitlements were similar.
  • Employees with leave entitlements recorded higher incidence rates than Employees without leave entitlements in all occupations. However, by industry employees without leave entitlements recorded higher rates in the agriculture, forestry and fishing and property and business service industries.

Full-time / Part-time

  • Part-time workers recorded a frequency rate of work-related injury more than twice the rate for full-time workers: 74 injuries per million hours worked compared to 35 for full-time workers.
  • Male part-time workers had higher rates of injury than female part-time workers.
  • Young part-time workers, who were less than 25 years old, had a higher rate of injury than older part-time workers.

In Australia OHS management is red tape

The Australian newspaper of 1 September 2009 epitomised the ideological problems with OHS in a business management context.  Page 5 has two articles next to each other:

Renewed pledge to cut business regulation” and

Building chief ‘spat on an abused‘”.

The first article reports on a speech by the Competition Minister, Craig Emerson, where it is reported that the Minister

“has pledged his commitment to removing unnecessary regulation that hampered business”.

The Minister was speaking to a business audience and has been described as less friendly to regulation than his predecessor.  OHS compliance is often bundled as an element of unnecessary business paperwork by employer and industry groups however, in this speech, the Minister spoke more of open markets.

The second article focuses on an attack on the head of the much-hated Australian Building & Construction Commission, John Lloyd, but also reports on the national union protest scheduled for 1 September 2009, concerning the weakening of OHS laws through the harmonisation process.

The article reports on a union survey:

“Unions commissioned a poll that showed 78 per cent of those surveyed agreed employers should do more to protect the health and safety of their workers, even if it led to increased costs or red tape.”

That unions would even accept that OHS compliance could be considered red tape is a great concern, and the phrase is taken directly from the ACTU media release.

Union Survey figures

SafetyAtWorkBlog is endeavouring to obtain the original survey results (over 1000 respondents (workers) taken in the last week of August 2009) but for the moment it is worth quoting ACTU Secretary Jeff Lawrence’s interpretation of the statistics.

“… this poll shows the Australian public don’t want workplace safety rights undermined.”

“The poll shows there is significant support in the Australian community for stronger rights and protections for workers and an ongoing role for unions in checking workplaces where employees are worried they are in danger.

“The poll finds 81 per cent of those surveyed agreed workers should have the right to call in help from a union to check on health and safety issues regardless of their employer’s approval.

“Seven out of ten Australians (69%) believe that injured workers should be able to take their employer to court under workplace health and safety laws.”

Business and government in Australia are harmonising OHS laws to reduce the red tape business compliance costs.  Unions believe that OHS red tape and increased business cost is acceptable.

What does this leave the safety professional who says that they can minimise the red tape associated with OHS compliance AND that safety is not a cost but an investment?  Out in the cold with the Victorian WorkCover Minister, it is suggested.

Kevin Jones

Productivity is also the Government’s aim with OHS law reform

A few posts back the productivity priorities of Australian employer groups toward OHS harmonisation were noted, particularly that of the Australian Chamber of Commerce & Industry.

On 25 August 2009, Australia’s Workplace Relations Minister, Julia Gillard, addressed the 15th World Congress International Industrial Relations Association.  The Minister mentioned OHS and said:

“So, our new workplace relations system is now up and running. We are close to reaching agreement with State Governments to end the fragmentation of the past and have the entire private sector by the one national workplace relations system.

Additionally, for the first time ever, after a 25-year wait, Australian businesses and workers are close to having a uniform national occupational health and safety laws. A massive step forward in achieving a seamless national economy that Australia needs to release lasting and much-needed productivity improvements.

But the legal changes are the beginning, not the end, of the reform process.

Australians should now move beyond a focus on law changes to a new focus on cultural change in the workplace. We need to build partnerships between management and workers and their unions that operate for the benefit of all.

Change of this sort is slower to take root than rapid structural reform.

It is more dependent on intangibles, including the goodwill and motivation of those who take part. But in the long run it will have an important impact on our economic prospects.

So over the coming months and years we will be looking at ways of embedding change through workplace relations, innovation and leadership practices in workplaces.” [my emphasis]

Minister Gillard talks of OHS law reform in the same productivity terms as the employer groups.  This may be down to the audience at the conference and the congress’ theme as well as industrial relations being the main focus of the government’s reform agenda but it is an inclusion that, for fairness, it was worth highlighting.

Rather than taking the OHS paragraph by itself, it is telling to see the section in the speech that includes the only direct mention of OHS law reform.  Minister Gillard continues to emphasise the process of establishing harmony across industrial relations as much as in OHS law.

She also is clearly up on the latest business lingo, even though some of the phrases have a cloudy definition –

  • “cultural change”
  • “intangibles”
  • “innovation”
  • “leadership”
  • “collaboration”

The Minister rightly states that law reform is at the end of one process but often at the start of a far more difficult reform process.  There is no guarantee that the new OHS will have a smooth entry and, as with any law, the best test for its suitability is in the Courts, sadly.

Kevin Jones

US workplace fatality statistics – 2008

Preliminary data on workplace fatalities was released recently by the Census of Fatal Occupational Injuries (CFOI) program in the United States.  Economic pressures have reduced the size of the workforce which, the data indicates, decreased fatalities.  Good news in one way but only status quo if one is looking at long-term trends or for some benefit from government workplace safety initiatives.

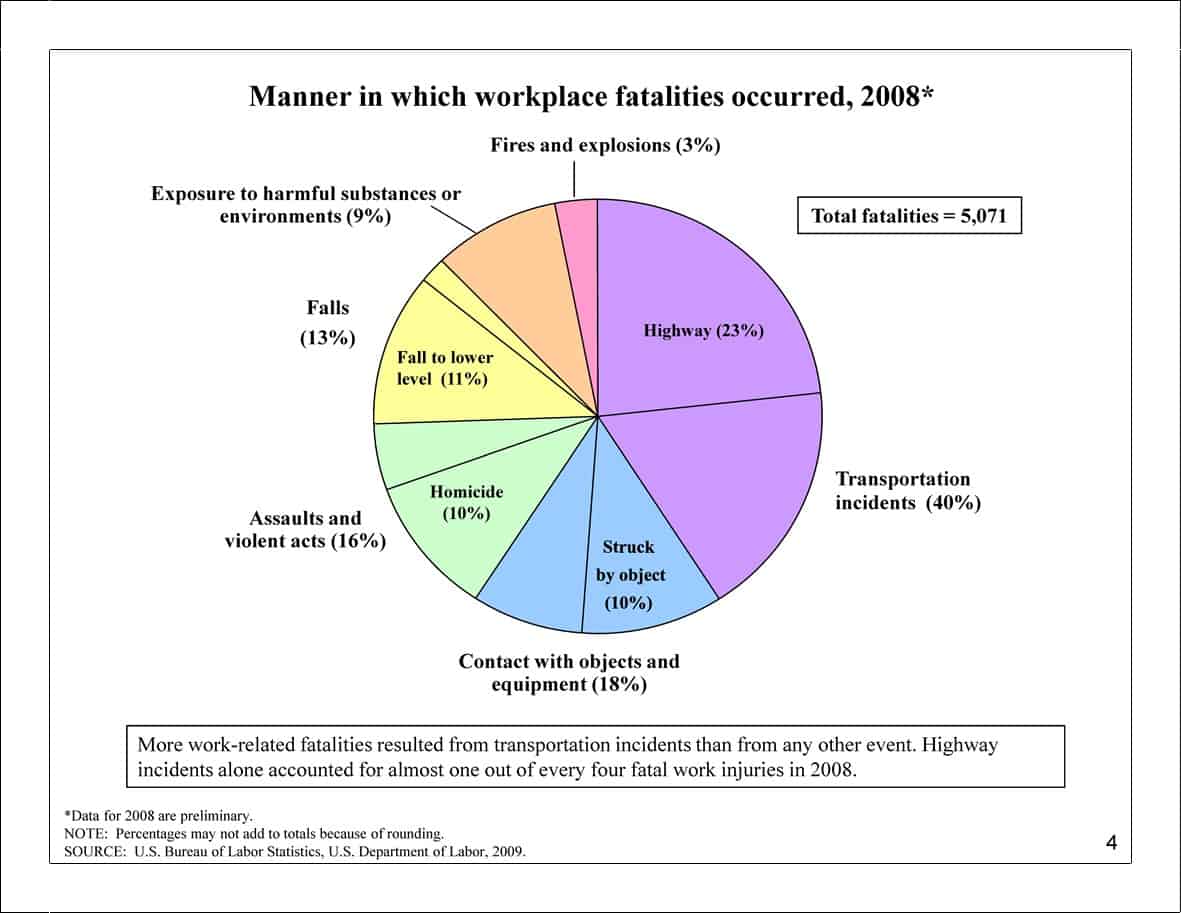
Benchmarking and statistics junkies will be able to extract a great deal of information from the preliminary data.  The chart below is a good example of the level of detail available.

cfch0007 chart

There was a passing mention in the media release which caught our attention – workplace suicides.  The media release states:

“Workplace suicides were up 28 percent to a series high of 251 cases in 2008, but workplace homicides declined 18 percent in 2008……

Workplace suicides rose from 196 cases in 2007 to 251 cases in 2008, an increase of 28 percent and the highest number ever reported by the fatality census. Suicides among protective service occupations rose from 14 in 2007 to 25 in 2008.”

Regular SafetyAtWorkBlog readers will understand that work-related suicides is an area that we consider under-researched, so the figures quoted are of particular interest although only a minor part of the statistical report.  It would be great if the Bureau of Labor Statistics revisited its 2004 analysis of workpalce suicides in light of this considerable statistical increase.

Kevin Jones

Concatenate Web Development
© Designed and developed by Concatenate Aust Pty Ltd