Global pressures on Australian workers compensation schemes

Around 18 months ago the Victoria Government launched WorkHealth, a health prevention program that would be funded from the interest generated from the pool of workers compensation funds.  SafetyAtWorkBlog has previously questioned how the program will be funded when its income source is likely to have been severely reduced due to the global economic problems.

On 1 April 2009 WorkCover in South Australia reported a half-year net loss of $313 million. WorkCover CEO Julia Davison said in a media release that

“the global crisis is, as expected, taking its toll.  In the last six months stock markets have declined, investors have experienced significant losses, and interest rates have fallen significantly,” she said  “Like all investors, WorkCover has been hit hard by the global financial downturn.”

Earlier in March 2009, the Chair of the WorkSafe Board Elana Rubin said 

“the significant downturn on the world financial markets and reduction in interest rates had combined to drive a net loss of $1.42 billion for the half year.  Whilst interest rate reductions are good news for those of us with mortgages, they have the opposite effect on our scheme – in the half year to 31 December 2008, the unprecedented level of interest rate cuts negatively impacted our net result by $645 million.”

On 1 April 2009 SafetyAtWorkBlog asked John Merritt why WorkHealth was not mentioned as part of his keynote presentation at the Safety In Action Conference.  He reiterated the importance of the program in easing the recovery time, particularly, for manual handling injuries but acknowledged that the program’s funding source was based on interest

“from the [$600 million of the assets of the] workers compensation scheme over the next five years ….well there used to be interest from assets – there should be one day, there will be again –  around $40 million each year for the next five years will be invested in worker health.”

It is good to hear that the WorkHealth program is going to continue but the fragility of the program’s funding should have been evident in the planning phase.  Governments around the world are pulling back on government funded programs in a wide range of areas.  Ideas that seem good in the good times are now looking like luxuries.  It will be interesting to see if WorkHealth continues in the WorkCover area or moves to Health, where many of its critics have always said it belongs.

Kevin Jones

BHP Billiton deaths – government intervention

The West Australian government has taken the extraordinary step of talking directly to the senior management of Australian mining corporation BHP Billiton about the recent spate of fatalities at BHP’s worksites.  The cynic would say that we now know the number of workplace fatalities that it takes to gain a Minister’s attention however, the fact that this high-level meeting is occurring is a clear indication of the severity of the issue.  It may also indicate just how effective a union safety campaign can be.  It is just regrettable the campaign is generated from multiple fatalities rather than preventive issues.

According to the Minister, Nick Moore 

“Mines inspectors will now issue prohibition notices to BHP under the Mines Safety and Inspection Act 1994 – basically a stop work notice – for any breach of work practices or work place conditions that may constitute a hazard to workers.”

Mr Moore went on to say, according to one media article, “…the policy would remain in force until he had seen the report of a Section 45 review currently under way into safety management systems at all of BHP Billiton’s Pilbara iron ore mine sites.” 

The article noted that

“The review, requiring independent engineering studies of BHP worksites to be carried out, is expected to be completed by April 30.”

BHP, meanwhile, has given guarantees of the following safety improvements:

  •          Reduce site access;
  •          Improve contractor management;
  •          Enhance existing strategies to prevent excess working hours;
  •          Move rail operations from the Mine Safety and Inspection Act to the Rail Safety Act;
  •          Enhance traffic management standards, and;
  •          Suspend all non-essential work outside daylight hours

Kevin Jones

Professor Quinlan outlines the roles and approaches of the OHS inspectorate

The Safety in Action conference is lucky to have Professor Michael Quinlan as a keynote speaker, as he has seriously curtailed his conference appearances to favour those that benefit the safety profession over the commercial conferences.  His, and Richard Johnstone’s, research on 1200 inspectors has provided useful insight into the effectiveness and roles of OHS inspectors.  The project also interviewed HSRs and employers and visited a large variety of workplaces.

Michael Quinlan at Safety In Action Conference

Inspectorate activity focused on in the report was in the traditional areas initially.  But although statistics overstate the effectiveness of the visits, the bulk of their activity relates to targeted strategies, as targeted enforcement provides a greater return.  This may be important to remember when listening to presentations from the regulators about their performance indicators.

Less than half of an inspector’s time is spent in talking with workers.  Most attention was on plant and documentation was low except in major hazard sites.  Inspectors don’t ask about the participatory structures which Quinlan sees as a major deficiency.

Inspectors currently have much better communication skills than in previous incarnations.

In 50% of the cases studied there is no action taken by inspectors, 25% are verbal instructions, improvement notices issued in 34%. 

The research also asked what standards were referred to by the inspectors with the most common being process or performance standards.  Inspectors are very hesitant in providing advice on potential solutions yet they are often the best placed to provide advice.

Inspectorate training has greatly improved and inspectors do apply their enforcement skills selectively.  Some employers want notices in order to gain the attention on safety matters from the executives.

“Zero Harm” often fades to zero injuries and becomes implemented more restrictively than intended due to the realisation of the workload in achieving  the corporate goals.

Inspectors are more cynical on audit tools because the tools in many cases have become checklist compliances with insufficient resources to improve safety in reality.

Inspectors struggle with psychosocial issues but the general opinion is that managing the issues will evolve in a similar way to that of manual handling over the last 20 years.  Often bullying cases can take up a lot of inspector’s time with less than perfect outcomes.

Inspectors are beginning to see safety within the business/management context and provide more assistance with managers.  Inspectors are very aware of the risks associated with paper compliance management systems.

Inspectors don’t interact sufficiently with unions and HSRs.  Well-managed worksites are prepared to include a second opinion on safety, often from unions.  Those sites that are not inclusive should raise a red flag.

Repeat visits by inspectors are the most effective technique in safety improvement but under-resourcing hampers this technique.

Kevin Jones

Mental Illness and Workplace Safety

Reports in the Australian media this week indicated that “nearly half the population has a common mental health problem at some point during their lives”.  Safety professionals and HR practitioners should take note of these statistics and hope that it does not manifest in their shift, even though it is likely.

The difficulty with trying to manage or anticipate mental health issues is that they seem to have evolved over time and multiplied.  There is the common phrase of “trying to herd cats” and it seems that mental health issues are the cats.  One could apply lateral thinking and propose the solution is to get a dog but will the dog herd a cat that doesn’t look like a cat, smell like a cat, or worst scenario of all, a cat that resembles a dog!

Because of the fluctuating psychiatric states of everyone everyday how does one recognise when a mood swing becomes a mental health issue.  Does one take everything as a mental health issue and waste time on frivolous matters?  Or is there no such thing as a frivolous matter?

In the one article there are these confusing and inconsistent terms for mental health:

  • “common mental health problem”
  • “mental condition”
  • “non psychotic psychiatric problems”
  • “mood disorder”
  • “anxiety disorder”
  • “mental health disorder”
  • “substance abuse or dependency”
  • “mental disorder”
  • “mental illness”
  • “psychiatric condition”

In this report it is unlikely that the synonyms have been generated by the journalist as the data quoted is from the Australian Bureau of Statistics, but it indicates the confusion that safety professionals can feel when they need to accommodate more recent workplace hazards – the psychosocial hazards.

The list above does not include the “established” hazards of bullying, occupational violence or stress.  The fact that there may be a clear differentiation between mental health symptoms and mental disorders but that needs to be clearly communicated to those who manage workplaces so that control resources can be allocated where best needed.

The article referred to above provides interesting statistics and there are gems of useful information in the ABS report but the article provides me with no clues about how to begin a coordinated program to address the mental health issues in the workplace.  It is an article without hope, without clues, without pathways on which the professional can act.

There is no doubt the psychosocial hazards at work are real but the advocates of intervention need to clarify the message.

Kevin Jones

(This blog posting does not discuss the recent changes to compensation for defence personnel and soldiers for mental health from combat, but mental health in that “industry” is a fascinating comparison to what occurs in the private sector.)

April 28 – Workers’ Memorial Day

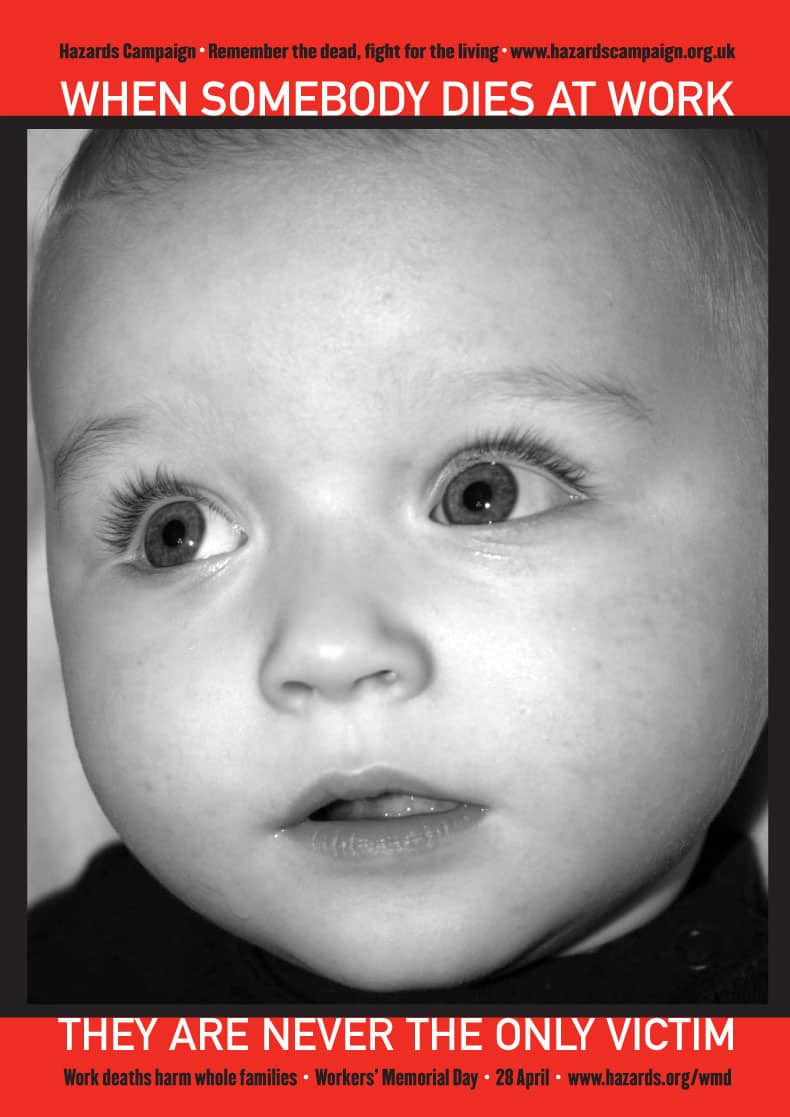
memorial-poster-2009This annual event seems to receive more attention in Europe than elsewhere although over the years several Australian capital cities have erected workers’ memorial stones.  It is usually here that ceremonies occur.

I always attend these services in my own right as it helps to keep me grounded as I wade through risk assessments, policies, consultations, and other safety ephemera.

One of the chilling parts of the service is always the reading of those who have died over the previous twelve months.  This has echoes of the 9/11 recital each year but for the worker memorial there is a new set of names each year and a new set of families and a new round of grieving.

Please check your local town and city activities lists and attend this year’s event.

In support, the UK’s Hazards magazine has produced a simple but effective poster that can be downloaded.

Kevin Jones


What’s really causing the reduction of Australian injury rates?

Elsewhere in SafetyAtWorkBlog is a summary of the recent statistics released by the Australian Safety & Compensation Council.  Overall the injury trends are positive but it is worth looking at the report a little closer.

On page viii, the report says

Due to large increases in employment, incidence rates fell 16%, from 18 serious claims per 1000 employees in 2000–01 to 15 in 2005–06 and frequency rates fell 14% from 11 serious claims per million hours worked to 9.” [my emphasis]

The ASCC has identified this particular trend, the fall in incidence rates, to labour force variations, not necessarily due to any of the enforcement policies or marketing of the OHS regulators.

Australia is currently bemoaning the loss of manufacturing industry offshore, principally to south-east asia and China.  This will inevitably skew the workplace injury rates as with less heavy industry there is less work activity and less injuries.

There are all sorts of ways of measuring performance, of finding positive indicators, and indicators that are proportional are favoured – percentage reductions by specific industries, for instance.

All of this may look good for the OHS regulators and economic statisticians but those who glance over statistics for a general impression should consider that Australia is exporting a large part of its homegrown manufacturing industry.  The industry that we have from overseas, such as the automotive industry, is collapsing. (There are persistent rumours that, regardless of the US bailouts, General Motors, will disappear or have its Australian subsidiaries being nationalised by the Australian government.)

Australia is, in effect, exporting those industries with the highest long-term injury rates.  As the Compendium indicates (p.11) in 2007-8 the most hazardous industries remained agriculture and construction, industries that we cannot export.

National OHS Strategy

The ASCC figures differ from those used to measure the performance of the ten-year National OHS Strategy 2002-2012.  The strategy set a reduction target of 40% on figures for work-related injuries with a 20% reduction by June 2007.  The Compendium reports:

“Data from the recently released Comparative Performance Monitoring Report, 10th Edition shows that the 16% improvement recorded from the base period up to 2006–07 is below the rate of improvement required to meet the target of a 40% reduction by June 2012.”  (p 11)

The OHS regulators have failed to meet their midway target even though the country has seen one of the most expensive safety awareness campaigns in its history and with a major reduction in the manufacturing industries.  No wonder some of them are falling back on the old-school, and expensive, measures of increased inspection and more robust enforcement.

The risk of setting any target is how to account for the failure to reach it.  Keep your eyes open for the preparative work by the regulators’ marketing departments on turning failure into  triumph, or at least in making it into an “SEF” – someone else’s fault.

Kevin Jones

Latest Australian OHS Statistics

Below is an edited summary of the findings from the latest compendium of statistics issued by the Australian Safety & Compensation Council.  The stats relate to 2006-07 primarily but with some comparative data from 2000-01 onwards.  The full report is available for download as is a media statement from the Council Chairman, Bill Scales.compendium200607-cover

132 055 serious workers’ compensation claims in 2006-07  = to 14 claims per 1000 employees or 9 claims per million hours worked.

Men accounted for 68% of all serious claims

Incidence rates for male employees almost twice that of females

There were 9 claims per 1000 employees aged 15-19 years, which increased to 17 claims per 1000 employees aged 60-64 years.

“The Manufacturing, Transport and storage, Agriculture, forestry and fishing, and Construction industries had incidence rates substantially above the national rate of 14 claims per 1000 employees.”

The occupational group with the highest incidence rate of serious claims was Labourers and related workers (39 claims per 1000 employees).

Transport workers and some others had the second highest rate with 29 claims per 1000 employees.

The majority (73%) of the serious claims involved injury or poisoning (95 910 claims)

The remaining 27% (36 145 claims) were disease related.

The most common injury (41%of all serious claims leading to a serious claim was Sprains and strains of joints and adjacent muscles.

Fractures and Open wounds (8% of all serious claims )not involving traumatic amputation were the next most common injuries

The most common diseases were:

  • Disorders of muscle, tendons and other soft tissues (7% of all serious claims),
  • Dorsopathies – disorders of spinal vertebrae (6%), and
  • Mental disorders (5%).

23% of all serious claims involved the Back. Hand (13%), Shoulder (9%) and Knee (9%).

Manual handling mechanisms (Body stressing) were the cause of 41% of all serious claims, with: 

  • lifting objects (18%)
  • handling objects (15%)

The most common mechanism was Falls on the same level (13%).

Non-powered handtools, appliances and equipment represented 26% of all serious claims.

Over the period 2000-01 to 2005-06, the number of serious claims decreased 6% from 144 740 claims to 136 575.

“The Agriculture, forestry and fishing industry recorded the highest time lost from work of 4.6 working weeks in 2005-06 but due to the lower salaries in this industry, it recorded one of the lowest median payment amounts ($5100 in 2005-06 compared to the all claims median of $6100).  The highest median payments were recorded in the Mining industry ($10 400 in 2005-06).”

Compensated Fatalities

Preliminary data show that in 2006-07 there were 236 compensated fatalities = an incidence rate of 2.5 fatalities per 100 000 employees.

Of the fatalities, 91% were male employees.

Over the period from 2000-01 and 2005-06, the number of fatalities fell 21%.

Industry

The Construction industry recorded the highest number of fatalities (50).

Transport and storage industry = 45 fatalities (of which 31 were in Road freight transport).

Mechanism of injury or disease

A third of the fatalities (81) were due to Vehicle accident

33 deaths due to Long term contact with chemicals or substances,

19 due to Being hit by moving objects and

18 due to Being hit by falling objects.

Concatenate Web Development
© Designed and developed by Concatenate Aust Pty Ltd