February 2010 was the first month for SafetyAtWorkBlog to achieve well over 10,000 readers. Thanks for all your support.
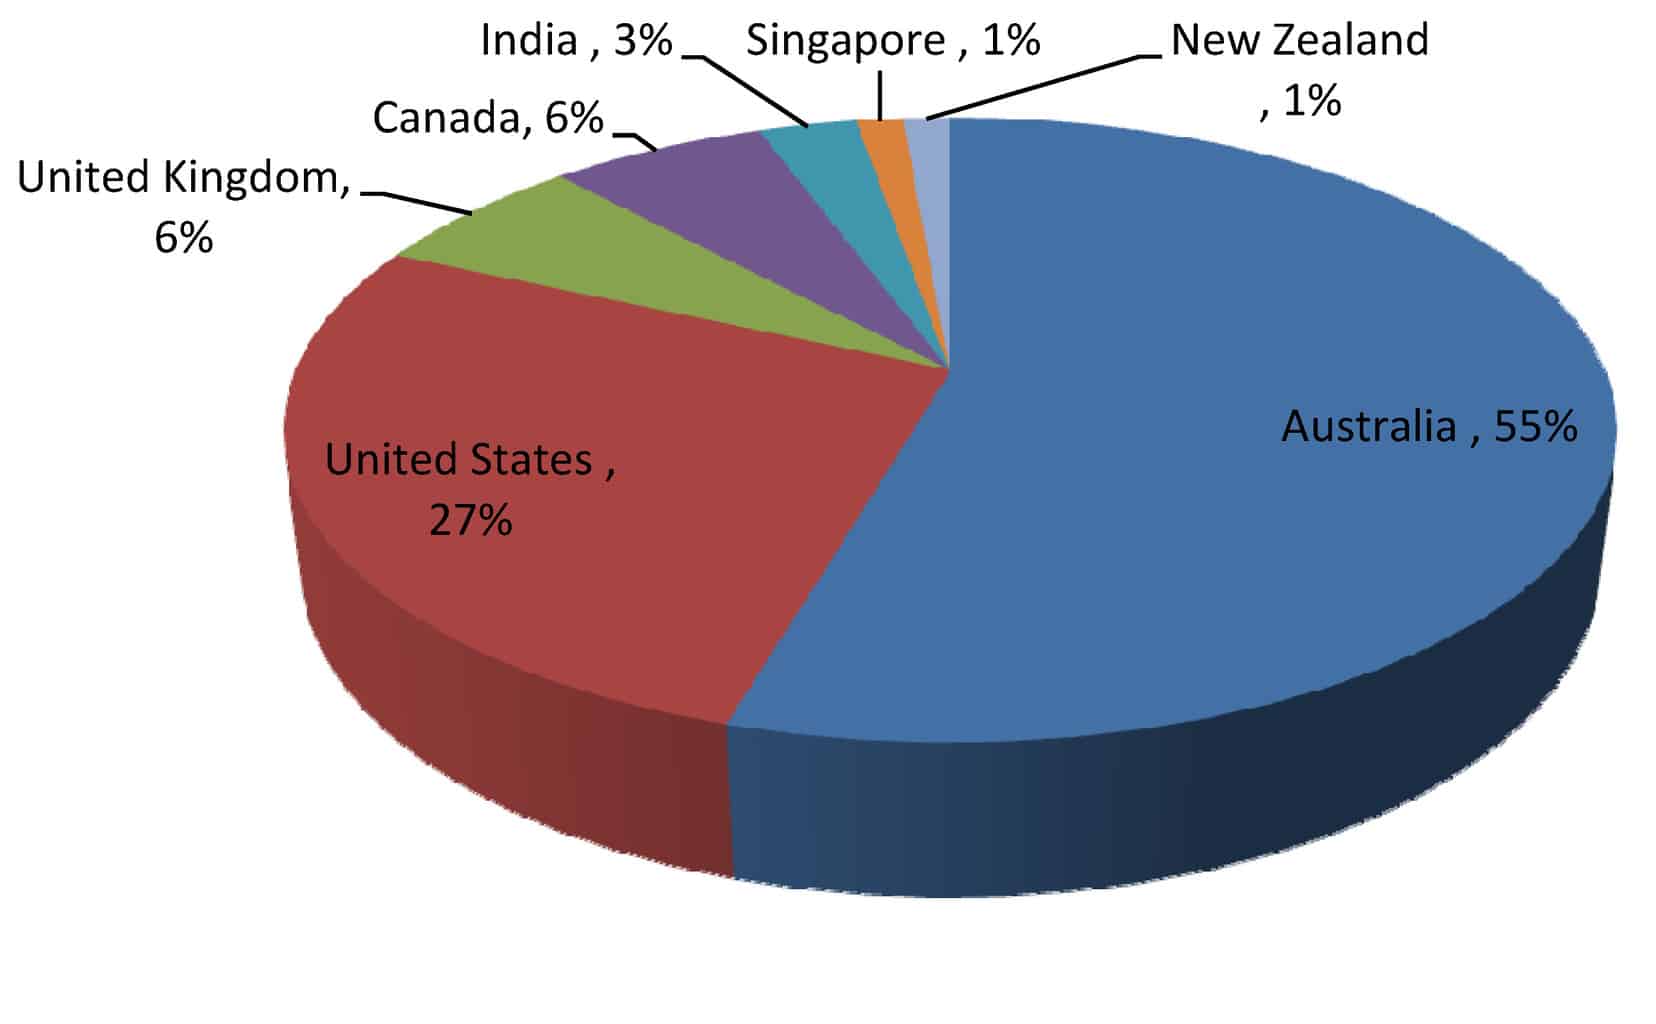
Also in February 2010, the ClustrMaps widget was installed. Every month or so the graphic representations on the world map will be reconfigured to show the countries from which the blog is being read. There are no privacy concerns with this as the only data we can access is country stats but those stats may be of interest to readers so a pie chart has been produced.
 The readership ratios are bound to vary in relation to issues in those regions. For instance, if this data was available for the period where we wrote about the Icepak explosion, the New Zealand numbers would be higher.
If one takes the monthly readership of 10,000, it is easy to get an idea of real numbers.

Congratulations Kevin. Kind of an odd feeling to think that 9,999 other people are reading what you have written and my replies.