The Queensland Premier, Campbell Newman, called a “snap” election for the end of January 2015. On 11 January 2015, Newman tweeted:
“Queenslanders injured at work are covered by Australia’s strongest workers’ compensation scheme.”
This is a further example of political newspeak as what does a “strong” workers’ compensation scheme look like? Newman’s tweet included an image that provides some clarity to his claim.
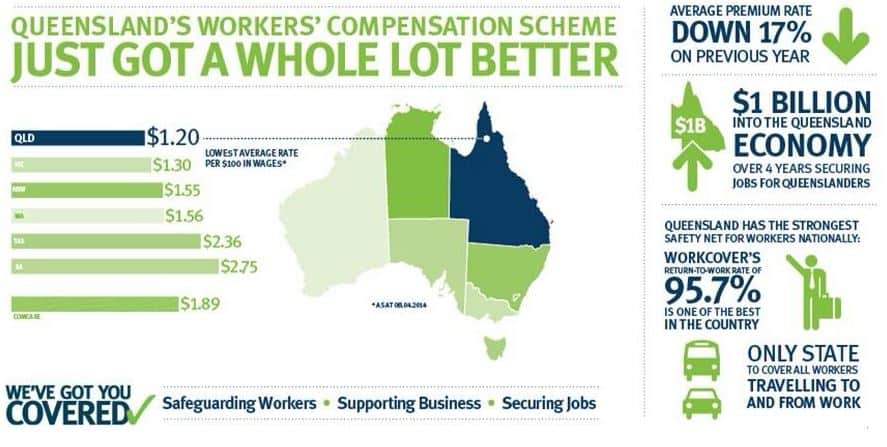
The comparison to other Australian States is “lowest average rate per $100 in wages”. Whether this is an accurate and fair benchmark is beyond this writer but it is useful to note that prior to Victoria’s November 2014 election, in June 2014, that State’s Minister for Workcover, Gordon Rich-Phillips stated that:
“For the six months to December 2013 Victorian workplaces recorded a claims performance of 7.3 claims per million hours worked. This is a record low level of WorkCover claims in Victoria, and it is the lowest level of WorkCover claims of any state in Australia. This continues the very strong performance by Victorian workplaces of low WorkCover claims.” (emphasis added)
and
“The average WorkCover premium in Victoria will fall to 1.272 per cent of payroll, which represents a reduction in the average premium of 2 per cent, which will save Victorian businesses $40 million a year.”(emphasis added)
The payroll figure is close to that included in Premier Newman’s infographic.
Looking at the glossary that Safe Work Australia provides in its regular statistical compendiums (page 109), it is difficult to find a valid comparison to the measure of “per $100 wages” in the Newman infographic.
Premier Newman also claims that his actions on workers compensation will inject
“$1 billion into the Queensland economy over 4 years…”
This seems odd when Victoria’s Rich-Phillips stated that a 2% reduction in premiums equates to a saving in business costs of only $40 million for one year. Over 4 years, this figure would be $160 million, substantially less than Newman’s $1 billion. Is it any wonder that such statements receive little traction with the electorate? It seems that such statements are not intended to be accurate and factual, rather they are an indication of the ideological commitment to business profitability, a reassurance to its business stakeholders and a re-commitment to capitalism. There is no commitment to improving worker safety by reducing harm.
The quote above ends with
“…over 4 years securing jobs for Queenslanders.”
This echoes the dominant political message in Australia that everything must lead to the creation of jobs. But this quote also implies that workers compensation relation costs are less important than job creation. Workers’ compensation is part of the job cycle and the experience of many workers, and should be calculated as such.
There is great benefit in beginning a job and the most productivity and profitability of that job would result from keeping that worker safe throughout that worker’s occupational lifetime. Any work injury or illness that takes that worker away from the workplace reduces that worker’s productivity/profitability and, if a workers’ compensation claim is lodged, increases costs to the employer. If Premier Newman is serious about reducing business costs and red tape, sometime during this election campaign he should be making a statement about increasing the advisory and, perhaps, inspection, services of Work Health and Safety Queensland.
Let’s finish this article with a comparison graph in the same format of the bar graph in Premier Newman’s infographic which shows Queensland’s OHS performance in terms of workplace fatalities (source from Safe Work Australia’s statistics (page 27)):
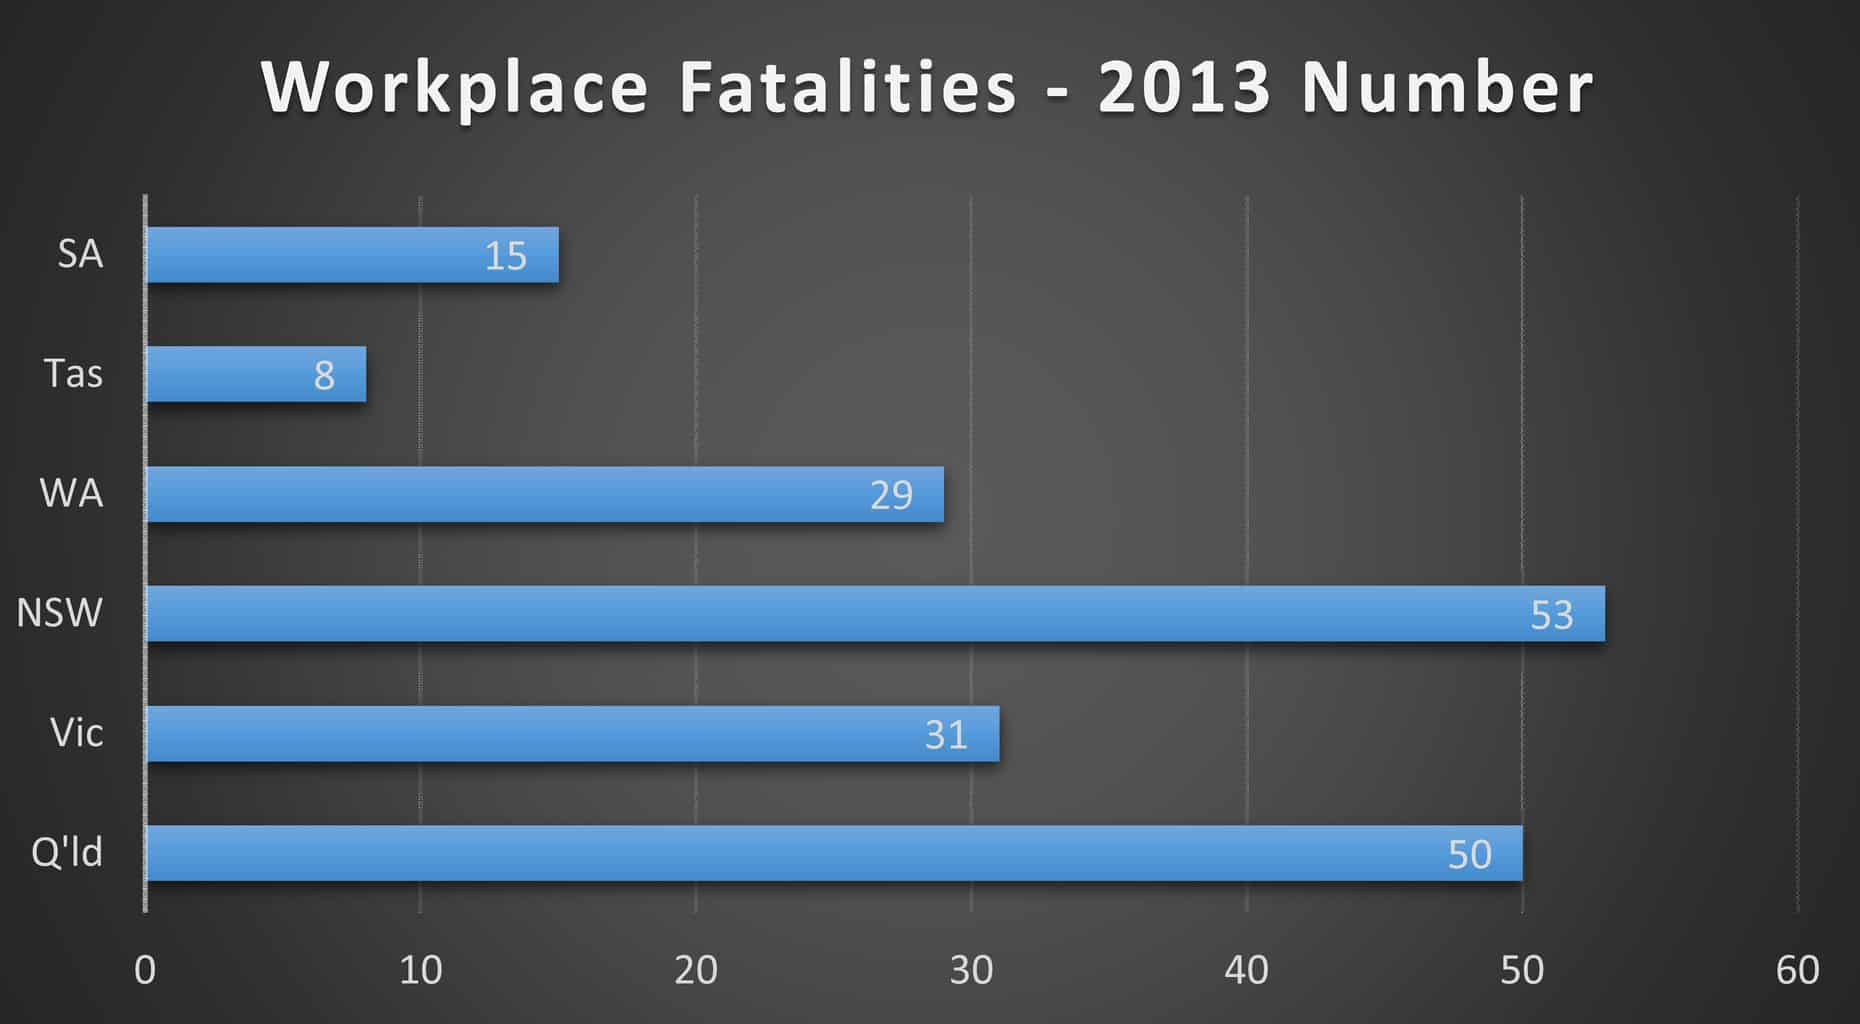
This graph shows Queensland as the State with the second highest number of workplace deaths in 2013. How different the election campaign would be if Premier Newman developed business and job creation policies using this measure?
Thanks Kevin for an interesting article … love the finishing paragraph and diagram. Hope the Premier will take the time to read and act on it.
Unfortunately Kevin OHS isn’t the only policy area to be subject to polticial spin, particularly during campaigns. Maybe the figures could be submitted to that ABC fact checking bloke?!
For overseas readers note that Victoria did not change their laws to the model set as did the other states and territories. Victoria, to my mind, already had a very well thought out OHS law; and a very strong focus on consultation and strong representation of workers.
It could appear in hindsight that, statistically at least, Victoria, in keeping the 2004 law, was making a good decision. Note that the 31 deaths in this set of data for Victoria is actually a spike upwards and against the trend so a “bad” result is still way better than elsewhere. In fact deaths have been as low as the low 20’s in the recent past. Not good enough, but good in comparison.
Anyway this measurement of workplace deaths is a lag indicator so not much use as a predictor of future results. That is why perhaps Kevin has flagged a vast and rapid improvement in NZ as being on the cards since the model laws are at least an improvement and a good PPI.
Thought I would just put in some data I found. The set of laws in Victoria appear to work well and this includes the method of regulation by the inspectorate and the inclusion of strong consultation requirements.
State Pop 7/2014 Work Deaths Deaths per mil pop
NSW 7,518.500 53 7.01
Victoria 5,841,700 31 5.31
Queensland 4,722,400 50 10.59
South Australia 1,685,700 15 8.89
Tasmania 573,000 8 13.95
NZ 4.471,000 102 22.81
Pretty rough stats I know but quite persuasive. Best chance of getting home alive seems to be Victoria. NZ stats look frightening. BTW pop stats per ABS and NZ stats as per 2013 figures (latest detectable)
Draw your own conclusions.
Thanks Ken, I tried to format them into a table but it didn’t work out.
Thanks for including New Zealand. I was recently reading WorkSafe NZ’s Annual Report. I think it was the first since their new WHS laws. I think NZ is THE country to watch for OHS innovation and performance.
One reader has pointed out that NSW has more employees than Queensland, so on a per capita basis Queensland may have the worse fatality record.
Kevin, the “per $100 in wages” is just used as it is easier to understand for the lay person than “percentage of payroll”. They both arrive at the exact same number but one has a dollar sign and one has a percentage sign. Dare I say that government feels that in QLD they need to make it easier to understand for their electorate, but in VIC they know that their electorate can read percentages? (cheeky dig)
The $1 Billion saving is no doubt a figure plucked form the air, but I bet they are adding in premium savings, saved downtime, early RTW, lower medical costs, bla bla, throwing it all together and getting roughly $1 Billion. Though having worked with a lot of actuaries, I don’t know how they could actually get this number and defend it as even close to correct.
Kevin In comparing the different state bodies responsible for workplace safety, statistics are not often comparable for differet industries for one state to another .
if we viewed these bodies as a type of PPI and compared their efforts on regular workplace visits and their monitoring of the workplace and how often these visits led to improvements it might give an idea of how resourced these bodies are .
If so many of these injuries are preventable surely that should be the focus of the inspectors, prevention that will reduce costs not having these insurance agencies play games with injured workers
You are right that the new Victorian Government has not made a clear statement on the the Work Health and Safety laws. We will keep asking why this is so.
Everything is politically motivated as politics, agendas, aims and wishes all have a politic component. “politically motivated” is often a term of criticism but is not necessarily so. Perhaps it may be worth thinking about more accurate terms like politically exploitative or manipulative that reflect one’s own political stance and perspective.
But as you don’t want to go into this, the comment is a bit pointless.
Seems to me New Victorian government has not mentioned at all what they are doing about WHS. Why is that ? Just asking as these articles are at best politically motivated. and is an area I do not wish to go into.
.